Relationship
Relationship graphs, implied by the name, show specific relationships, correlation, or connections between 2 or more variables.
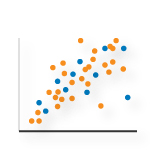
Relationship Types
On a high level, these charts demonstrate how a variable such as price does or does not affect another variable such as demand and whether that relationship is positive or negative. These visualizations can be given another dimenstion with bubble charts that show the scale of the relationship or plots over time. Chart types include scatter plots, bubble, line, and table. Relationship graphs could answer:
- Does variable a depend on variable b?
- Is there a positive or negative relationship between my two variables?
-
Does the user need to see 3 to 4 dimensions of analysis: correlation, clusters, outliers, timeline?