Distribution
Distribution analaysis visualizes data to see what data deviates from the norm and can also be used geographically to demonstrate data over a map.
Distribution Graph Types
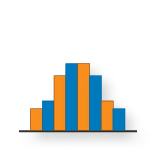
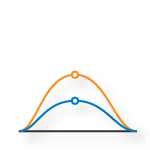
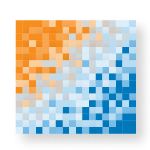
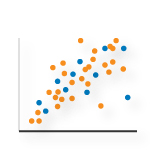
Charts used in this category include histograms, line and area charts, scatter plots, data tables, and map charts. Distribution graphs can answer:
- What correlation between a cause and effect of a variable?
- Does my user need to spot bugs or constraints in their system?
- Does my consumer need a visual for a variable such as profits over different categories such as clients?